Table of Contents
Setting up an Indigo Plugin Development Environment
If you're interested in developing an Indigo plugin to share with other users or just for yourself, the way you approach development can make a big difference. Whether you choose to write your Indigo plugin without any specialized tools or expensive software packages, or instead choose one of the open source applications – or even a plain text editor – there are ways to make the process easier and more streamlined. This page describes many authoring packages and steps you can take to make your effort more successful.
Integrated Development Environments
Using an Integrated Development Environment (IDE) can make writing Indigo plugins much easier. IDEs are programming environments that can help you reference Python functions, make recommendations on syntax, and even color code and highlight sections of code to make things easier for you. There are way too many Python IDEs to list them all here, but the more poplar ones include (in alphabetical order):
- Atom - Atom is a free and open-source text and source code editor for macOS, Linux, and Microsoft Windows with support for plug-ins written in JavaScript, and embedded Git Control. It was developed by GitHub. NOTE: Atom and all projects under the Atom organization are slated for an official sunset on December 15, 2022.
- BBEdit - BBEdit is a proprietary text editor made by Bare Bones Software, originally developed for Macintosh System Software 6, and currently supporting macOS. The free version of BBEdit works very well for writing Indigo plugins, and the paid version includes some IDE-type integration as well.
- PyCharm - PyCharm is an excellent full-featured commercial Python development environment made by Jetbrains. There are several licenses available for PyCharm from paid to free – the license you need depends on what you use the program for. NOTE: for certain features (including the ability to debug Indigo plugins from within the IDE) require a paid PyCharm Professional Edition license.
- Spyder - Spyder is an open-source cross-platform integrated development environment for scientific programming in the Python language. While it is more geared towards scientific programming, it works for non-scientific applications, too.
- Sublime Text - Sublime Text is a shareware cross-platform source code editor. It natively supports many programming languages and markup languages. Users can expand its functionality with plugins, typically community-built and maintained under free-software licenses.
- VSCode - VSCode is a free source code editor made by Microsoft that runs on Mac, Linux and Windows. VSCode is an extremely popular tool used for Python development.
Other Editors
You can use any of several great text editors to write plugin code, but one aspect is crucial – they must be able to save plain text files.
- TextEdit - the editor that ships with macOS. If you choose to use Apple's TextEdit app, when you save your code to file, you MUST select Make Plain Text from the Format menu, and when you save, be sure that the Plain Text Encoding is set to
Unicode (UTF-8). - vim - Vim is a highly configurable text editor built to make creating and changing any kind of text very efficient. It is included as “vi” with most UNIX systems and with Apple OS X.
Setting Up Your Development Environment
Choosing what tools to use to develop your plugin is only one of the considerations you'll need to address. You'll also need to decide how you're going to configure your environment.
- Project organization considerations – will you be developing on the same machine where your Indigo server lives? Where will your project files be located? On your machine? Online? A common approach is to have a separate folder structure just for development – with subfolders dedicated to each project. You should also consider whether you'll benefit from a common location within your project space that can be used for segments of code that you'll use across multiple plugin projects.
- Virtual environments – some developers choose to build their projects using virtual environments. This allows for each project to reside in a separate environment where changes can be made to one environment while leaving the others unchanged. For example, installing different versions of Python libraries depending on the project's needs.
- Backups and version control – You'll want to save your work along the way. Backups are easy. Make them. Often. But you'll also want to be in a position to be able to revert back to prior versions in case you decide to undo some changes you've made. Github is a popular choice, but there are other options out there and you can always roll your own.
- Plugin versioning – You'll need to come up with a way to assign version numbers to your plugin. By incrementing the version number with each release, Indigo will be better able to identify updates and more easily install them–version numbers are required if you release your plugin through the Indigo Plugin Store. There are many ways to do versioning, but it's common to use a two- or three-number semantic versioning system where:
- Major version - often incremented with substantial changes to the software.
- Minor version - often incremented with new features or enhancements.
- Patch - often incremented with bug fixes and minor code refinements.
- Collaboration – will you be working on the plugin by yourself or will you be coordinating with other developers? If you're working in a group environment, you'll need to establish a method (again, Github is a popular choice) but also protocols for how your team's work will be combined.
- Symlinks – Once you're ready to test your code, you'll need to install your plugin on your Indigo server in order for it to run and access to the Indigo Object Model Framework (IOM). You could choose to install your plugin like you would with any other plugin, but there is a better way – using symbolic links. A link allows your “original” plugin code to remain outside the Indigo file system but in a place where the Indigo server will still see it. Creating symlinks for your development plugins using the Terminal app is easy:
- Open two Finder windows, one pointing to the folder that contains your plugin code and the second pointing to the Indigo file tree.
- First, type the following command in Terminal:
ln -s
- Drag your plugin file and drop it on the Terminal window.
- Drag the Indigo Plugins (Disabled) folder and drop it on the Terminal window, so it looks something like this:
User@My Mac ~ % ln -s /Users/User/My Development Environment/my_plugin.indigoPlugin /Library/Application\ Support/Perceptive\ Automation/Indigo\ 2022.1/Plugins\ \(Disabled\)
- Switch to Terminal and hit return. If things went according to plan, you should see your plugin in the Plugins (Disabled) folder with a small arrow in the lower left corner (indicating that it's a linked file).
- Restart the Indigo server and you should see your plugin in the Plugins Menu. With the file successfully linked, you can safely Enable and Disable the plugin in Indigo and the operating system will update the symbolic link accordingly. You can then safely make changes to your code, save, and reload the plugin in Indigo.
- Hosting – If you choose to share your plugin with the world, you'll need a place to host the plugin files so that others can download it.
- Indigo Plugin Store – The recommended way to share plugins with other Indigo users is via the Indigo Plugin Store. By using the store, you get a central place where users can search for plugins to solve various scenarios, you get built-in version notifications to users via the Mac Client, etc. Check out the Plugin Store Submission Guidelines.
- Github – Many developers manage their plugin code on GitHub, and in fact you can configure your Plugin Store entry to pull information and releases from Github (which is the recommended way of adding plugins to the store). GitHub is a very powerful tool used for distribution, version tracking, collaboration and other things. A GitHub account is free with a few limitations that most users won't encounter.
- Providing Support – If you choose to share your plugin with others, it's inevitable that someone will have a question, an issue, or want to contribute code to your effort. There are a variety of ways to do this, but there are several common approaches that developers currently use:
- Indigo Forums - many developers have dedicated forums for their plugins on the Indigo forums site. If you think your plugin might qualify for its own forum, please contact Support.
- Github Wikis - many developers write documentation for their plugins, and on popular way to make that available to others is by creating a dedicated wiki page on Github.
- Plugin Issues - Some developers prefer users report problems via the Indigo forums, while others prefer users to file issues on Github.
Debugging
As a quick summary, Indigo plugins and scripts must run in a special process called the Indigo Plugin Host. That process bridges Indigo native objects (C++ objects) to python. One side effect of this requirement is that debugging a plugin has some special challenges. For instance, you can't directly debug plugins from most of the IDEs listed above.
However, we have facilitated the use a several Python debuggers together with Indigo:
Each has its pros and cons, but all are a significant improvement over self.logger.debug()…
In the Plugins Preferences tab, there is a Development section:
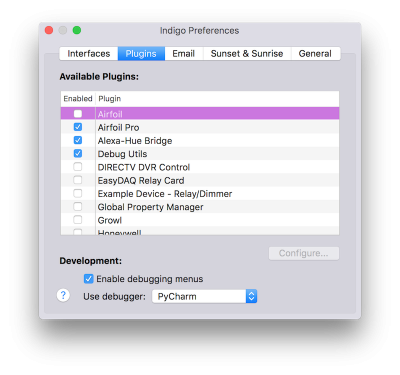 (Bet you didn't even remember that tab was there). Because we need to start plugins in a special way for debugging to work, we need to show some special debugging menus. Check the checkbox to see those menus in each plugin's submenu. Next, each debugger needs to be started in a specific way, so select the debugger that you want to use.
By enabling debugging menus, each plugin will have some additional menu items on their submenu:
- Enable/Reload in Debugger
- Enable/Reload in Interactive Shell (discussed below)
Selecting the first will enable or restart the plugin with the plumbing enabled for the debugger you selected. We'll talk about the specifics for each next.
pdb
pdb is a command line debugger that's built-in to Python. We'll let you read the docs to find commands and features. What you do need to know is when you select Enable/Reload in Debugger, Indigo will restart your plugin and open a terminal window running pdb:
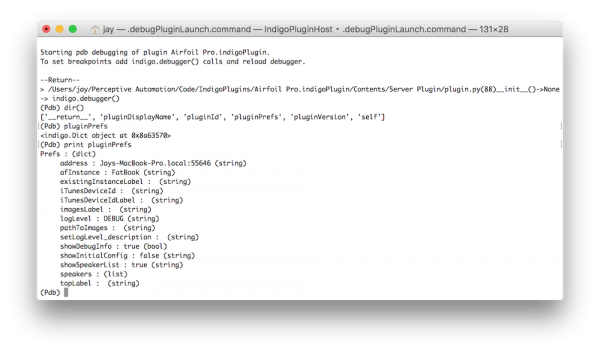 To add breakpoints to your code, you just add
 indigo.debugger() method calls where ever you want plugin execution to pause in the debugger. Trying to interactively add breakpoints from pdb or PuDB is hit-or-miss because of the threaded way in which Indigo plugins run. The most reliable to way to force a breakpoint is by manually adding the indigo.debugger() call to the python source and restarting the plugin. Also note indigo.debugger() calls are ignored (NOPs) when the plugin is not launched in debugger mode, so don't lose sleep over leaving an indigo.debugger() call in a shipping plugin.
PuDB
PuDB is a more graphical debugger (though it's still character based), much like to the old Borland Turbo Debugger from many years ago:
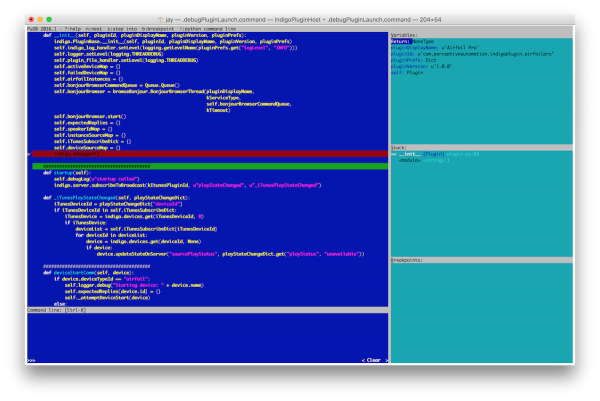 As with pdb, you add breakpoints to your code by adding
 indigo.debugger() method calls where ever you want plugin execution to pause in the debugger.
PyCharm
Finally, we were able to use PyCharm's Python Debug Server feature to enable plugin debugging (formerly referred to as “remote debugging”). It requires a bit more setup, but if want to use a fantastic modern IDE, this is the choice for you. Note: because we're using the Debug Server feature, you can only use the paid professional version of PyCharm as the community edition doesn't support it.
Configure Local Debugging
The most straight-forward debug configuration is to use PyCharm to debug your plugin running in Indigo on the same Mac. With your plugin's project open in PyCharm, create a run configuration of type Python Debug Server (formerly Remote Python Debug):
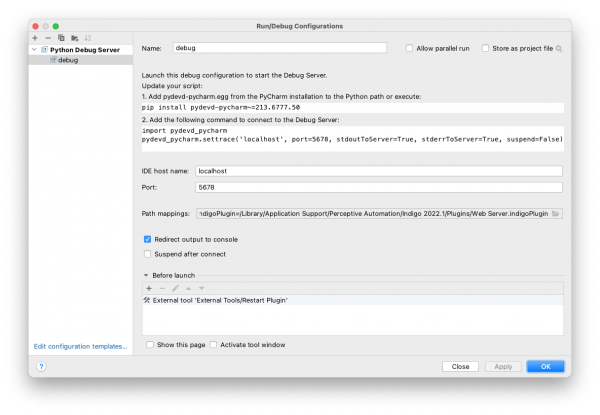
There are three important config parameters in this dialog (you can name the configuration anything you want). The first two tell how to connect: specify localhost in the Local host name box and 5678 in the Port field. The next field you need to adjust is the Path mappings field.
Recall that the recommended way of developing Indigo plugins is to put your plugin in a central location (not inside the Indigo folders), then make a symbolic link to it in the Plugins directory. We do this because the Indigo server moves a plugin between two different folders when enabling/disabling. An IDE/editor will get confused when this happens, so by putting the actual code in a place that never moves and allowing the Indigo Server to move a symbolic link around, you get around this issue.
Because of this, you need to tell PyCharm where the actual path to the source is when the plugin is enabled and being debugged. Click the ellipsis button at the end of the Path mappings field to add a mapping. On the Local path side, you want to specify the actual path to your plugin's source (i.e. /Users/you/path/to/myplugin.indigoPlugin). On the Remote path side, you want to specify the path to your plugin's symlink when the plugin is enabled (i.e. /Library/Application Support/Perceptive Automation/Indigo 2022.1/Plugins/myplugin.indigoPlugin). TIP: to get the path to a file in the Finder, right click on the file to show the contextual menu, then press the Option key. The Copy item will change to Copy as Pathname which is exactly what you want.
One other option is the Suspend after connect checkbox: if you have that checked, then when your plugin restarts with the debugger, it will pause execution in the init() method. We don't recommend doing this since you can add breakpoints anywhere you want in the code, including in the init() method.
That's it for setup! To debug, just run the debug configuration and then restart your plugin in the debugger. Unlike when using pdb and PuDB, you don't need to add explicit breakpoints to the source code using indigo.debugger() – rather, just interactively add breakpoints in PyCharm:
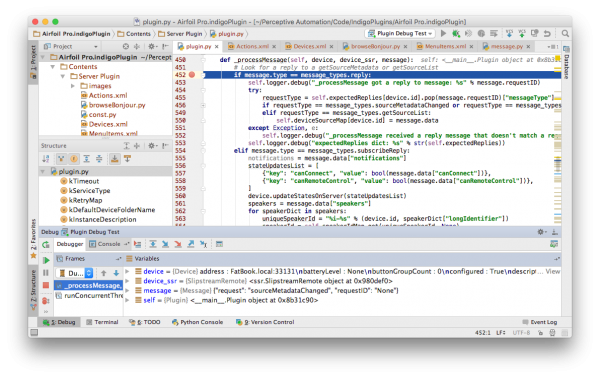 You can step through code, inspect, etc., just like you are debugging any other Python project.
We hope that you'll find a great debugging solution for your needs in one of these options. We've added a couple of new API methods on the plugin objects that are part of this change:
plugin.isRunning()– will return true if the plugin is enabled, initialized, and running, andplugin.restartAndDebug()– a parallel to therestart()method except that it starts the plugin running in the selected debugger.
PyCharm Plugin Restart Tool
In PyCharm, you can add “External Tools” like linters and custom tools as you build out your development environment. This script is a convenience tool which allows you to restart an Indigo plugin directly from PyCharm. For example, you might make changes to your plugin code and need to restart the plugin to continue debugging. This approach allows you to do this all through the PyCharm UI. The Python code you need for the external tool is:
#! /usr/bin/python3

import os
import sys
import argparse
import plistlib

def searchFile(fileName, path):
    return None

def main(argv):
    parser = argparse.ArgumentParser(
        description="Restart a plugin given it's full name or ID"
    )
    parser.add_argument(
        "project_directory",
        help="the project directory in which to search",
        type=str
    )

    args = parser.parse_args()

    info_plist = None
    found = False
    for root, dirs, files in os.walk(args.project_directory, topdown=False):
        if not found:
            for name in files:
                if name == "Info.plist":
                    info_plist = os.path.join(root, name)
                    found = True
                    break
    if info_plist:
        with open(info_plist, "rb") as f:
            # plist_data = f.read()
            # print(plist_data)
            plist_dict = plistlib.load(f, fmt=plistlib.FMT_XML)
            os.system(f"/usr/local/indigo/indigo-restart-plugin -d -n {plist_dict['CFBundleIdentifier']}")
    else:
        print("Info.plist not found")

if __name__ == "__main__":
    main(sys.argv[1:])
And you would set up the external tool with these settings:
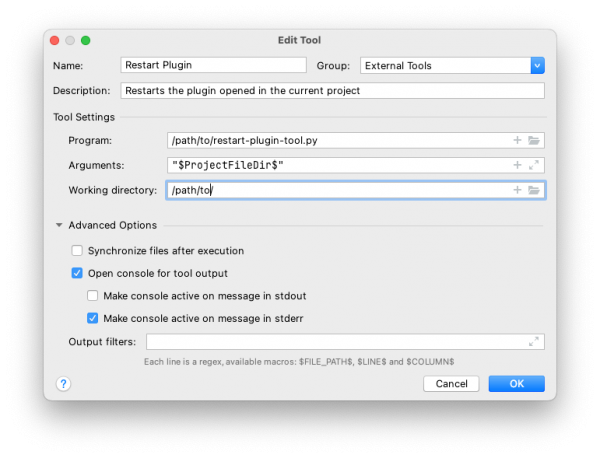
Now, when you use that External Tool, it will reload your plugin with the debugger enabled. You can even configure your debug run configuration to run this as a Before launch tool (see the configuration image above). So every time you run the debug configuration, it will also restart the plugin.
Configure Remote Debugging (Experimental)
The above local debugging configuration presumes that the Indigo Server and the plugin you are debugging are running on the same machine on which you are running PyCharm. It's also possible (and experimental at this point) to debug a plugin running on an Indigo Server on a separate Mac on the network from the one on which you are running PyCharm. We're listing this approach as experimental for the time being as it hasn't been fully tested; however, the implementation shows promise.
The setup is isn't radically different than the local configuration outlined above: it's the same “Python Debug Server” configuration, EXCEPT that you specify an IP address. In the Debug configuration in PyCharm you specify the IP address of the Mac PyCharm is running on (local won't work, it has to be the IP address). In the plugin's init method, make the very first line of the init method:
def __init__(self, pluginId, pluginDisplayName, pluginVersion, pluginPrefs):
    indigo.DEBUG_SERVER_IP = "192.168.1.24"  # IP address of the Mac running PyCharm
    super(Plugin, self).__init__(pluginId, pluginDisplayName, pluginVersion, pluginPrefs)
    self.debug = self.pluginPrefs.get("showDebugInfo", False)
    # Etc...
Note that it must happen before you call the super method. You can use the same port number (5678 by default) or you can specify a custom port as well by setting indigo.DEBUG_SERVER_PORT along with the IP. Another note: you must remove any custom IP addresses/ports that you specify in the plugin before distributing your plugin to avoid any erroneous error messages during startup on users' Indigo Servers.
The next requirement is that the EXACT same version of PyCharm has to be installed in the remote Mac's /Applications/ directory. It doesn't have to be licensed (and you don't have to launch it). It needs to be there and match exactly because Indigo looks for the debug module inside the PyCharm application bundle, and it has to be the exact same module on both sides of the connection. You might be tempted to try to install it from pip3, and while it looks like the same pydevd-pycharm version exists on pypi (the pip repository) that PyCharm is using, we've found that it just doesn't work consistently when installed from pip. It's best to put PyCharm on the remote Indigo Server Mac (and make sure PyCharm is the same version on both Macs).
Plugin Specific Interactive Shell
Another great debugging tool is the ability to open a scripting shell that's specific to your plugin's context. This shell is like the more general shell you get when you select the Plugins→Open Scripting Shell menu item, except that because we launch it as part of your plugin's startup, it has access to everything in your plugin. You can call methods that your plugin implements, inspect your plugin's objects, etc.
Tips, Tricks and Best Practices
External Requirements
Python has a huge collection of libraries/modules available on pypi.org and installable with the pip3 command. Your plugin can use those libraries, and by specifying which of those libraries in a requirements.txt file, Indigo will automatically install those when your plugin first starts. Check out the Python Packages for Plugin Developers section of the developer docs (starting with the 2023.2 release) for more details.
One option for setting up your development environment would be to create a virtual environment into which you install/manage the libraries that your plugin will need. This is best done when you first start working on a plugin or when you make significant changes (additional libraries, etc). There's lots of information available online regarding setting up and working with virtual environments–it may be best to start at the source.
Once you create a virtual environment (let's say you named it venv), this is what it's directory structure will look like:
- venv
  - bin
  - lib
    - python3.XX
      - site-packages
  - pyvenv.cfg
The site-packages directory is where any pip-installed modules (in that venv) will be installed. You can make a symbolic link from to directory as your Contents/Packages directory using a command like this:
ln -s /path/to/venv/lib/python3.XX/site-packages /path/to/YourPlugin.indigoPlugin/Contents/Packages
and then you can do this:
touch /path/to/YourPlugin.indigoPlugin/Contents/Packages/pip-install-log-success.txt
This will keep the plugin host process from trying to install any requirements.txt file that you have in the Server Plugin folder.
Then, you just manage the packages in the venv as necessary until you are satisfied that you have everything working. Once you are ready to release your plugin, then you can generate the requirements.txt file (make sure the terminal window you're using has the venv activated):
pip3 freeze > "/path/to/YourPlugin.indigoPlugin/Contents/Server Plugin/requirements.txt"
And this will write out the packages you have installed in your venv that the host process will install for the user. The last step would be to remove (or just move out of the way) the Packages directory, and create a release for your plugin using whatever method you currently use.
Indigo Utilities
Indigo ships with several command line utilities – several of which can help you with your development efforts. The tools can be found in the user/local/indigo folder. From the command prompt, type:
indigo-restart-plugin- to restart a plugin. Pass the plugin ID as an argument:indigo-restart-plugin com.myOrganization.my_pluginFor security reasons, you can not start a plugin that was not previously running and you can not stop a running plugin. OnlyRestartis allowable and only one plugin can be restarted at a time.indigo-clean-and-zip-plugin- to package a plugin file for distribution (more below).indigo-start- to start the Indigo server. This utility will only work if the “Auto start Indigo Server on user login” option is checked within the Indigo Server preferences pane.indigo-host- to start an interactive shell session with the Indigo server (the same as if started from the Plugins menu in the Indigo UI).indigo-stop- to send a stop signal to the Indigo server.
The indigo-clean-and-zip-plugin utility is especially useful for developers. You can use this utility to prepare your indigoPlugin file for distribution. The utility will inspect the plugin package and remove unnecessary files (such as .pyc files) and zip the plugin package to the same location as the plugin file. Using the clean and zip tool before publishing your plugin is highly recommended.
Linters
There are several utilities available to improve your code; one type of utility is often referred to as a “Linter”. Linters inspect your code for things that you might want to address including:
- Syntax problems,
- Duplicated code segments,
- typos, and
- other potential issues.
Even if your code is running the way you expect, a linter may still suggest potential improvements.
How to Tell if a Plugin was Started in Debug Mode
If you want to know whether your plugin was started in debug mode, you can call indigo.host.debugMode. The method will return an int, so you'll need to cast it to a bool. If it's `True` it's in debug mode, otherwise `False`.
debug_mode = indigo.host.debugMode
debug_mode_bool = bool(debug_mode)
No Module Named 'indigo'
Your preferred IDE may provide some automated syntax checking; highlighting potential errors in your code. Typically, plugins will often make references to the Indigo base class indigo.* and your syntax checker might alert you that it can't find the indigo module. This is to be expected because you can't import Indigo into a plugin like you can with standard Python modules. However, you can minimize the number of syntax error alerts by “tricking” your IDE by including the following with your other import statements:
try:
    import indigo
except ImportError:
    pass
You will likely still get a syntax error warning on the import indigo line, but this is preferable to many, many syntax warnings throughout your code base.
